


In our previous engineering roadmap post, we described how we were planning to make polyextremophiles (🧂😵🥶☢️) that can thrive on Mars. A critical step of our plan is to create assays 📏 that are both feasible and quantitative, because it’s impossible to get traction and do good science unless you can reliably measure the values that matter.
In our experience there’s often a before and after to having good measurements. It’s like switching on the light in a darkened room, where you start to be able to see things and make progress that would have been impossible before. We call this traction, and it’s an idea both Erika and Devon have written about before. Traction is when you have questions to answer and the tools to answer them. It’s the place where good science happens.
Today we’re glad to share that we’ve achieved traction! We can precisely and reliably 📏 measure the 🧂salt tolerance of bacteria in liquid culture. If you want to see the other approaches we tried, we’ve included data on failed experiments, as well as some lessons learned. Finally, we’re teasing how we use this assay to measure improved salt tolerance in strains we have genetically engineered with functional genomics.
The key experiment: dose-response
We measure the relative inhibitory concentration of salt with a dose-response experiment. Our experiments show that a strain expressing the previously published salt tolerance gene Dr-IrrE has 10% higher salt tolerance than strains expressing a series of negative controls like the fluorescent protein mStayGold and the freeze-thaw tolerance gene dWhy.

This means we’re replicating the literature, and assigning quantifiable numbers to salt tolerance increases.
The general protocol for the salt tolerance measurement is fairly simple.
From glycerol stocks, start 4 biological replicates of each strain in 96-well plates.
The next day, OD normalize your overnights and seed them at OD 0.01 in a broad range of salt concentrations. Grow overnight in 96-well plates.
The next day, measure the final OD of your cultures and plot it, then fit a dose-response curve and extract the IC50 value & 95% confidence intervals
Normalize the IC50 values by dividing them by the negative control (mStaygold) value from the same experiment.
Past Literature & Failed Approaches
We didn’t start with the idea of doing dose-response curves for salt concentration. At first we took inspiration from the literature, where it is common to show growth curves for a salt tolerant strain & a control strain in salt as evidence of salt tolerance.

However, we quickly discovered that growth curves in salt are extraordinarily variable, and it’s nearly impossible to make this into a reproducible measurement. We tried to directly replicate the above graph on two different occasions and saw different results each time.
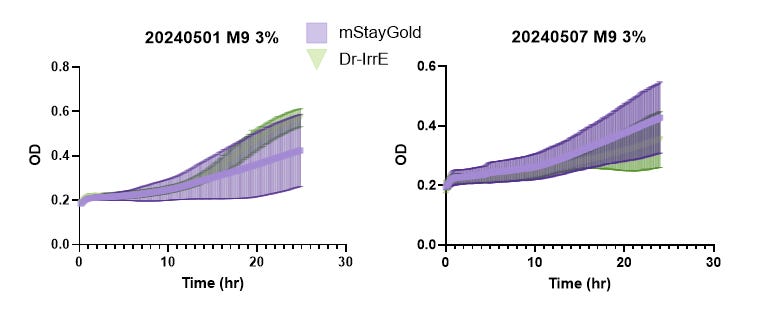
We stuck with growth curves because it’s the most common method in the literature. Other papers showed larger differences in LB (here, and figure 2 here), so we tried to replicate their results too. In the graphs below you can see that the Dr-IrrE probably improves salt tolerance, but it’s hard to say conclusively and one experiment shows the opposite result!
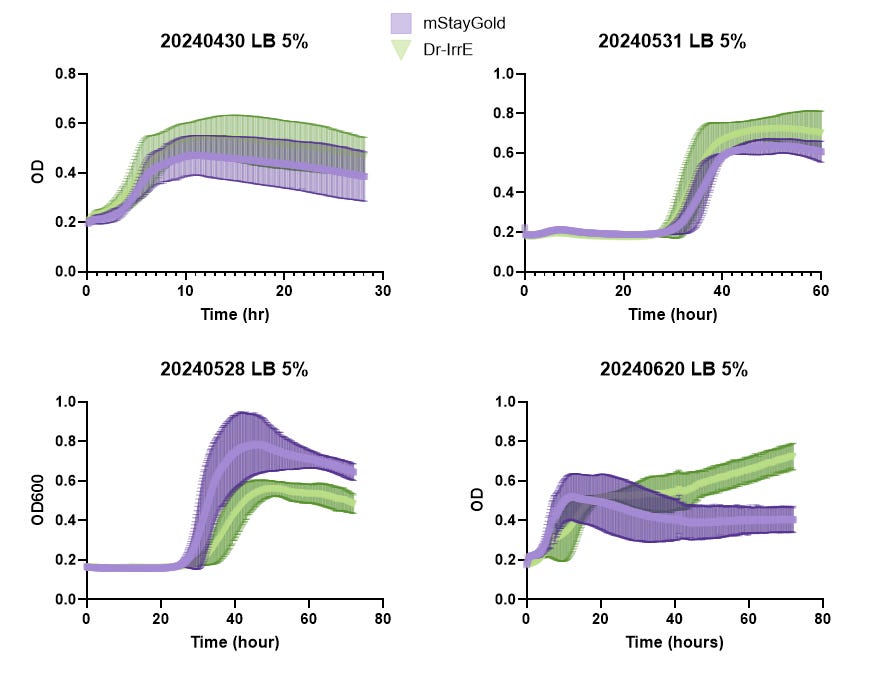
We tried a half-dozen things to make these experiments more reliable and reduce the noise, including fitting curves to extract summary statistics like lag time and growth rate, but nothing worked. Past approaches using growth curves to demonstrate salt tolerance aren’t incorrect, but we needed something more repeatable and quantitative for the experiments we’re doing.
The Details Matter!
There’s a lot of ways for things to go wrong in any experiment. Here’s a short list of things that we identified that are responsible for variation from day to day in our IC50 dose-response experiment.
Plate shaking conditions. This experiment is not especially repeatable if you shake the deep-well growth plates at 250 pm, the shake speed of a normal incubator. We purchased shaking incubators designed for 96-well cell culture plates that shake at 1000 rpm. This achieves more consistent growth and aeration across the plate, which is critical for this experiment.
Media prep details. We see variation in this experiment with different bottles of media, even if those bottles came from the same original bottle of powder. Normalizing to a control is a good way to reduce this variation, but carefully maintaining media standardization is important.
Starter culture conditions. We saw variation in the experiment if we grew the starter cultures differently, even if they were OD normalized before seeding into the experimental cultures.
Copy number variation. We’re using p15A for these experiments, a low-copy plasmid with low variation in copy number. However, it still does vary in copy number and thus expression & cell burden. We did these experiments with 4 independent transformants of each construct to to try to capture the average performance across high and low copy number variants. We do see that some of our Dr-IrrE clones do consistently better and others do consistently worse.
Bubbles in the plates. We used a mix of by-hand and automation to mix and seed our experimental plates, and then again to dilute them down for OD600 reading. During the transition to automation we found that the exact details of how you program the mixing & transfer steps matter, since otherwise you’ll sometimes introduce bubbles that will increase variability in the OD600 measure.
Experimental Development:
Want to learn more? Access our experiments directly! We’re including direct links to our lab notebooks for key experiments. This offers you access to the ‘primary source’ rather than us spending the time to produce a publication-quality version of the same data. Our hope is by doing this we can iterate our findings and feedback faster than is possible with traditional scientific publication.
The lab notebook that generated the data for the first experiment above is available here.
The full write-up for our normalization, including the summary of many more experiments, coefficient of variation analysis & plans for further improvement can be found here.
What’s next?
Now we can expand this framework to other conditions. The first and most obvious one is perchlorate, a toxic component of Martian soil. Based on early exploratory data, perchlorate looks very amenable to the same kind of dose-response analysis that works for salt 😵.

As part of our roadmap, we described the basic pipeline where we build libraries by taking DNA from intractable extremophiles, fragment it and insert it into more tractable hosts. We have started to get strains out of that pipeline, and our assay shows that they have significantly improved salt tolerance over our expression control mStayGold!

We’re still working out the kinks in our functional genetics pipeline, but now that we have a good assay to measure outcomes we can give it our full attention, and hopefully start iterating to continually improve salt tolerance! Expect a writeup soon about generating large functional genomics libraries from metagenomic samples 🛠!
Follow along
We want to get feedback on our work faster than traditional scientific publishing will allow. That’s why we’re posting our science updates here. Please do comment below if you have thoughts, on this post or the attached lab notebooks, and sign up to get future updates!
In other news, we’re looking for new Research Associate to join our team in December 2024 or January 2025. If you’re just finished your undergrad or masters and are excited about making microbes for Mars, you can apply here!
Thanks to Rachel Dutton, Jamie Bacher & Christina Agapakis for giving comments on this post, as well as the entirety of the Pioneer Team!
Cite as: Pioneer Labs Reports (2025). We can reliably measure salt tolerance. figshare. Online resource. https://doi.org/10.6084/m9.figshare.29042432.v1


